
Health Inequalities Explained: What They Are and the Impact on Primary Care
Health inequalities are one of the most significant challenges facing the NHS today, yet the term is often used without a clear explanation of what it means in practice, who it affects, and why it persists. This post sets out the essentials: what health inequalities are, what drives them, and why primary care sits at the centre of the response.
What Are Health Inequalities?
Health inequalities are avoidable, unfair and systematic differences in health outcomes between different groups of people. They show up in how long people live, which conditions they develop, and the quality of care they can access. They are not random variation. They are the predictable result of the conditions in which people are born, grow up, live and work.
It is worth distinguishing between two related but distinct terms. Health inequalities refer broadly to differences in health status across the population. Healthcare inequalities refer more specifically to differences in access to, and quality of, health services. Both are serious. Both affect the same communities. But addressing them requires different levers.
The Scale of the Problem
The data is striking: men in the most deprived areas of England live, on average, 10.4 years fewer than men in the least deprived areas. For women, the gap is 8.4 years. These are not historical figures — they reflect the current state of health in England (data from 2025).
The inequality runs deeper than life expectancy alone. In the least deprived fifth of England, people develop two or more long-term conditions on average at around age 71. In the most deprived fifth, they reach this same level of illness a decade earlier, at around 61. Deprivation does not just shorten life. It compresses the healthy years within it.
The trajectory is worsening. A 2024 Lancet Public Health study projected that multimorbidity prevalence in England will rise by 34% between 2019 and 2049. The projected increase is steepest in the most deprived communities, with an excess of over one million additional multimorbidity cases in the most deprived quintile compared to the least deprived over that period.
What Causes Health Inequalities?
The root causes are social and structural, not individual. They are referred to collectively as the social determinants of health: the conditions that shape people's daily lives and their long-term health.
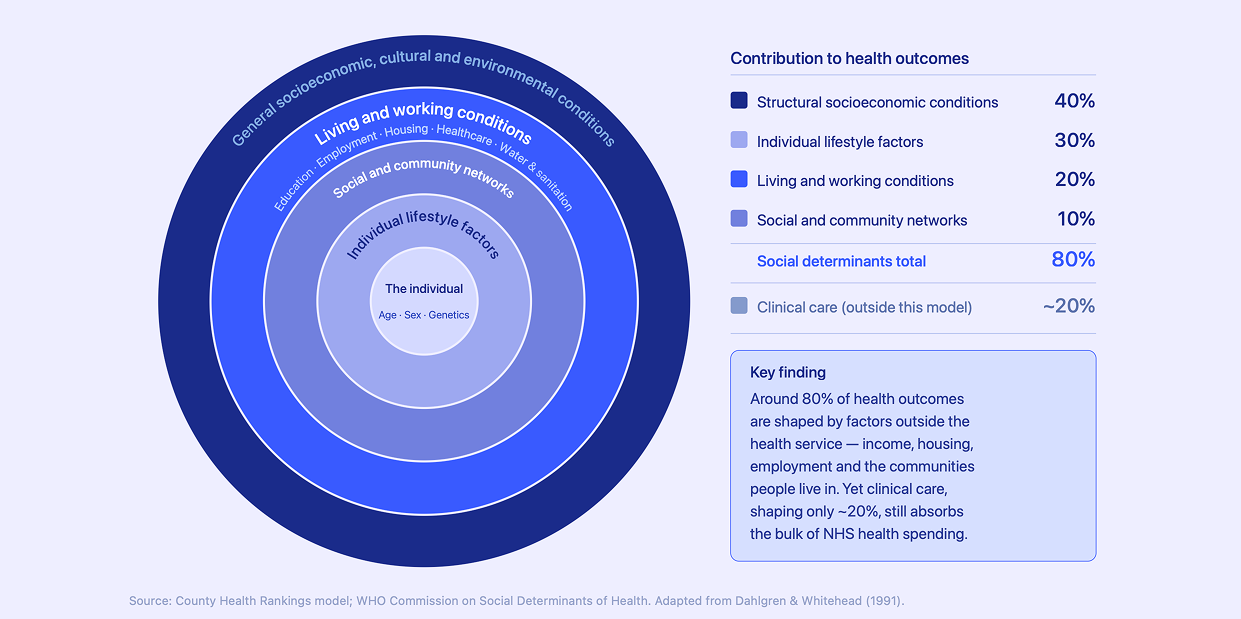
Research is consistent on how much each layer contributes. Around 80% of health outcomes are shaped by factors outside the health service. The breakdown, based on the County Health Rankings model and WHO Commission on Social Determinants of Health, is roughly as follows: structural socioeconomic conditions account for approximately 40% of health outcomes; individual health behaviours for 30%; living and working conditions, including housing and environment, for 20%; and social and community networks for the remaining 10%. Clinical care — the part of the system that receives the significant majority of NHS investment — accounts for only around 20% of health outcomes overall.
This is not an argument against clinical care, but it does raise questions about where the leverage sits in the system and whether spending in the NHS is achieving the highest value for money. The widest determinants of health are not modified only by activities in GP surgeries or hospitals.
Income and employment are among the most significant structural factors. Financial insecurity limits access to nutritious food, safe housing, and the time needed to manage health. Precarious or physically demanding work increases exposure to health risks.
Housing and environment matter enormously. Poor-quality, overcrowded, or damp housing increases respiratory illness, mental health problems, and the spread of infection. Air quality, green space, and access to active travel all vary significantly by area.
Education and health literacy shape people's ability to understand and navigate health services, engage with preventive care, and manage long-term conditions effectively.
Ethnicity intersects with all of the above. Many ethnic minority groups face compounding disadvantages: higher rates of certain conditions, greater exposure to socioeconomic risk factors, and well-documented disparities in the quality of care received.
Geography remains a persistent dividing line. A person's postcode is still one of the strongest predictors of their health outcomes. The north-south divide in England is well documented, but inequalities exist within regions, cities, and even neighbourhoods — including the east-west divide that gained significant attention in Michael Marmot's The Health Gap.
How Health Inequalities Show Up in Primary Care
Primary care is often the first point of contact for patients from the most disadvantaged communities. It is also where the consequences of health inequalities are most visible.
Practices in deprived areas typically carry higher clinical loads. Their patients are more likely to present with multiple long-term conditions, mental health comorbidities, and complex social needs. This can mean that consultations are more demanding and continuity of care is harder to maintain.
And yet, these practices are frequently under-resourced. GP funding in England is largely based on capitation: a payment per registered patient. This model does not adequately reflect clinical complexity. A deprived practice managing a patient population with high multimorbidity requires significantly more clinical time and resource per consultation than the funding formula accounts for. We have also written about how there is a marginal cost problem in proactive care that causes practices serving more deprived communities to face significant challenges when engaging hard-to-reach patients, meaning they miss out on incentive income that their peers in more affluent neighbourhoods find it easier to earn. The Health Foundation has documented clearly that primary care in poorer areas is missing out on vital funding as a result.
This creates what the GP Julian Tudor Hart described in 1971 as the inverse care law: the availability of good medical care tends to vary inversely with the need for it in the population served. More than fifty years later, the observation still holds.
Hospital admissions compound the picture. People living in the most deprived 20% of areas are admitted to hospital for infectious disease at nearly twice the rate of those in the least deprived areas. Prevention has failed. Primary care has been overwhelmed. The system absorbs the cost downstream.
The Connection to Multimorbidity
Health inequalities and multimorbidity are not separate problems. They are the same problem viewed from different angles.
Multimorbidity clusters in deprived communities. It starts earlier. It progresses faster. It is more likely to include mental health conditions alongside physical ones. And it demands a kind of care that the current system is not well structured to provide: proactive, personalised, coordinated, and consistent over time.
Understanding health inequalities is therefore essential context for understanding why multimorbidity is so difficult to address at scale. Treating individual conditions in isolation will not close the gap. The approach has to be population-level, proactive, and equity-aware.
For a fuller explanation of multimorbidity and its impact on the NHS, see our post: Multimorbidity Explained: What it is and the impact on the NHS.
What Needs to Change
The NHS has begun to formalise its response. Core20PLUS5 is the national framework for tackling healthcare inequalities, focusing attention on the most deprived 20% of the population and five clinical areas with the starkest disparities. The National Healthcare Inequalities Improvement Programme coordinates action across NHS England.
These frameworks are important. But strategy and delivery are different things. Closing the gap requires primary care to move from reactive to proactive: identifying the patients most at risk before they deteriorate, engaging them through the right channels, and coordinating their care across the conditions they actually have rather than treating each one in isolation.
That work happens at practice and PCN level. It requires data, capacity, and tools that most primary care teams currently lack. Addressing health inequalities is not a policy challenge alone. It is a delivery challenge. And primary care is where delivery either happens or it does not.

Marmot, M. (2015). The Health Gap: The Challenge of an Unequal World. Bloomsbury Publishing.
County Health Rankings Model. University of Wisconsin Population Health Institute. countyhealthrankings.org
WHO Commission on Social Determinants of Health (2008). Closing the gap in a generation. World Health Organization.
Dahlgren, G. and Whitehead, M. (1991). Policies and strategies to promote social equity in health. Stockholm: Institute for Futures Studies.
The Lancet Public Health (2024). Socioeconomic inequalities in accumulation of multimorbidity in England from 2019 to 2049. thelancet.com
The King's Fund. What are health inequalities? kingsfund.org.uk
The Health Foundation. Primary care in poorer areas missing out on vital funding. health.org.uk
ONS Health State Life Expectancies by national deprivation decile, England.

